


A production site may already collect thousands of measurements every day. Nevertheless, operators can still find it difficult to answer a seemingly simple question:
What is happening in the process right now?
The challenge is rarely a complete lack of data. More often, the relevant information is distributed across machines, databases and individual software systems.
The starting point
Consider a processing line with several consecutive production steps. Each machine records its own operating states and measurements.
Available signals may include:
- motor currents
- temperatures
- material levels
- throughput measurements
- warning messages
- machine states
- manual operator entries
The data exists, but names, units and time intervals are not necessarily consistent.
Collecting more signals does not automatically create more process knowledge. Context is what turns measurements into useful information.
Step 1: Understand the available signals
The first task is not building a dashboard. It is understanding what the individual data points represent.
For each relevant signal, the following information should be documented:
- physical meaning
- unit
- recording frequency
- source system
- expected operating range
- relationship to the production process
A signal named Value_17, for example, cannot be interpreted safely without additional context.
Step 2: Connect signals with machine states
Measurements become more meaningful when they are linked to operating conditions. A high motor current may be normal during machine start-up but unusual during stable operation. The same numerical value can therefore have a different meaning depending on the machine state.
Combining measurements with state information makes it possible to distinguish between:
- regular production
- start-up and shutdown
- idle periods
- maintenance activities
- process disturbances
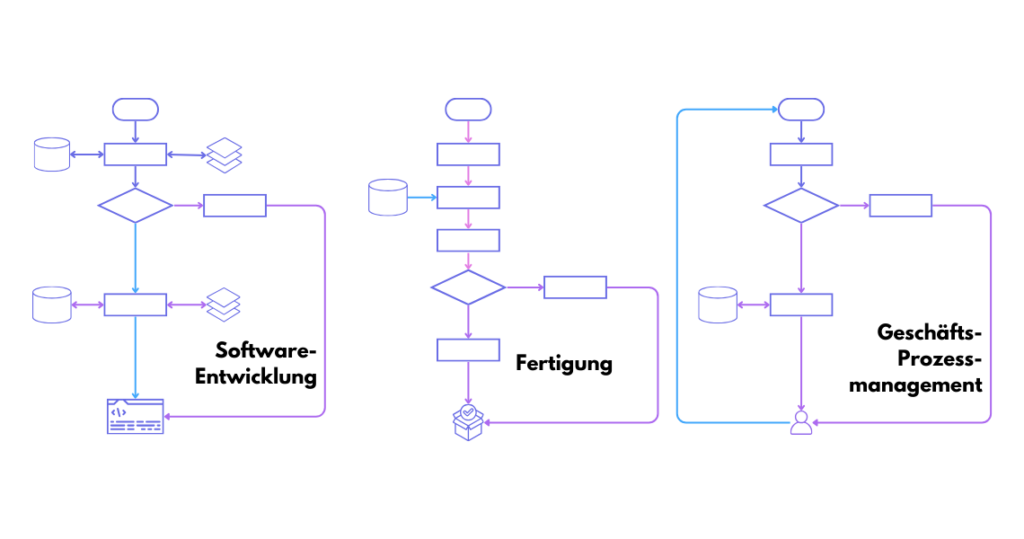
Assigning signals to their process steps creates the context required for meaningful analysis.
Step 3: Build the overview around decisions
A useful production overview should not display every available measurement. It should help a defined group of users make a defined decision.
For example:
| User | Typical Question | Relevant Information |
|---|---|---|
| Plant operator | Is the process currently stable? | Machine states, alarms and current values |
| Production manager | Where are we losing throughput? | Production rates, stops and bottlenecks |
| Maintenance team | Which equipment requires attention? | Deviations, trends and recurring warnings |
This decision-oriented approach keeps the overview focused and prevents information overload.
What the first version should contain
A practical first version can be deliberately small. It may include:
- the current state of the main machines
- production throughput over time
- the most important process parameters
- recent warnings and interruptions
- a comparison with a normal operating period
Additional functions can be introduced after users have tested the initial version.
The results
Structuring and connecting the available signals creates a shared production view. Operators no longer need to compare several systems manually, while analysts receive a more reliable basis for deeper evaluations.
The same structured data can later support applications such as:
- automated reporting
- anomaly detection
- bottleneck analysis
- predictive maintenance
- process optimization
Start with the process question
The most effective data projects begin with a concrete operational question rather than a software tool.
Which decision should become easier? Which signals are required for this decision? And how reliable are these signals?
Answering these questions creates a solid foundation for a useful and scalable solution
Are your machine signals already telling the full story?
We help industrial teams structure process data, connect information from different systems and turn machine signals into practical decision support.
Explore more eSENSEial snacks.
Explore more eSENSEial snacks on SmartProcessing.