

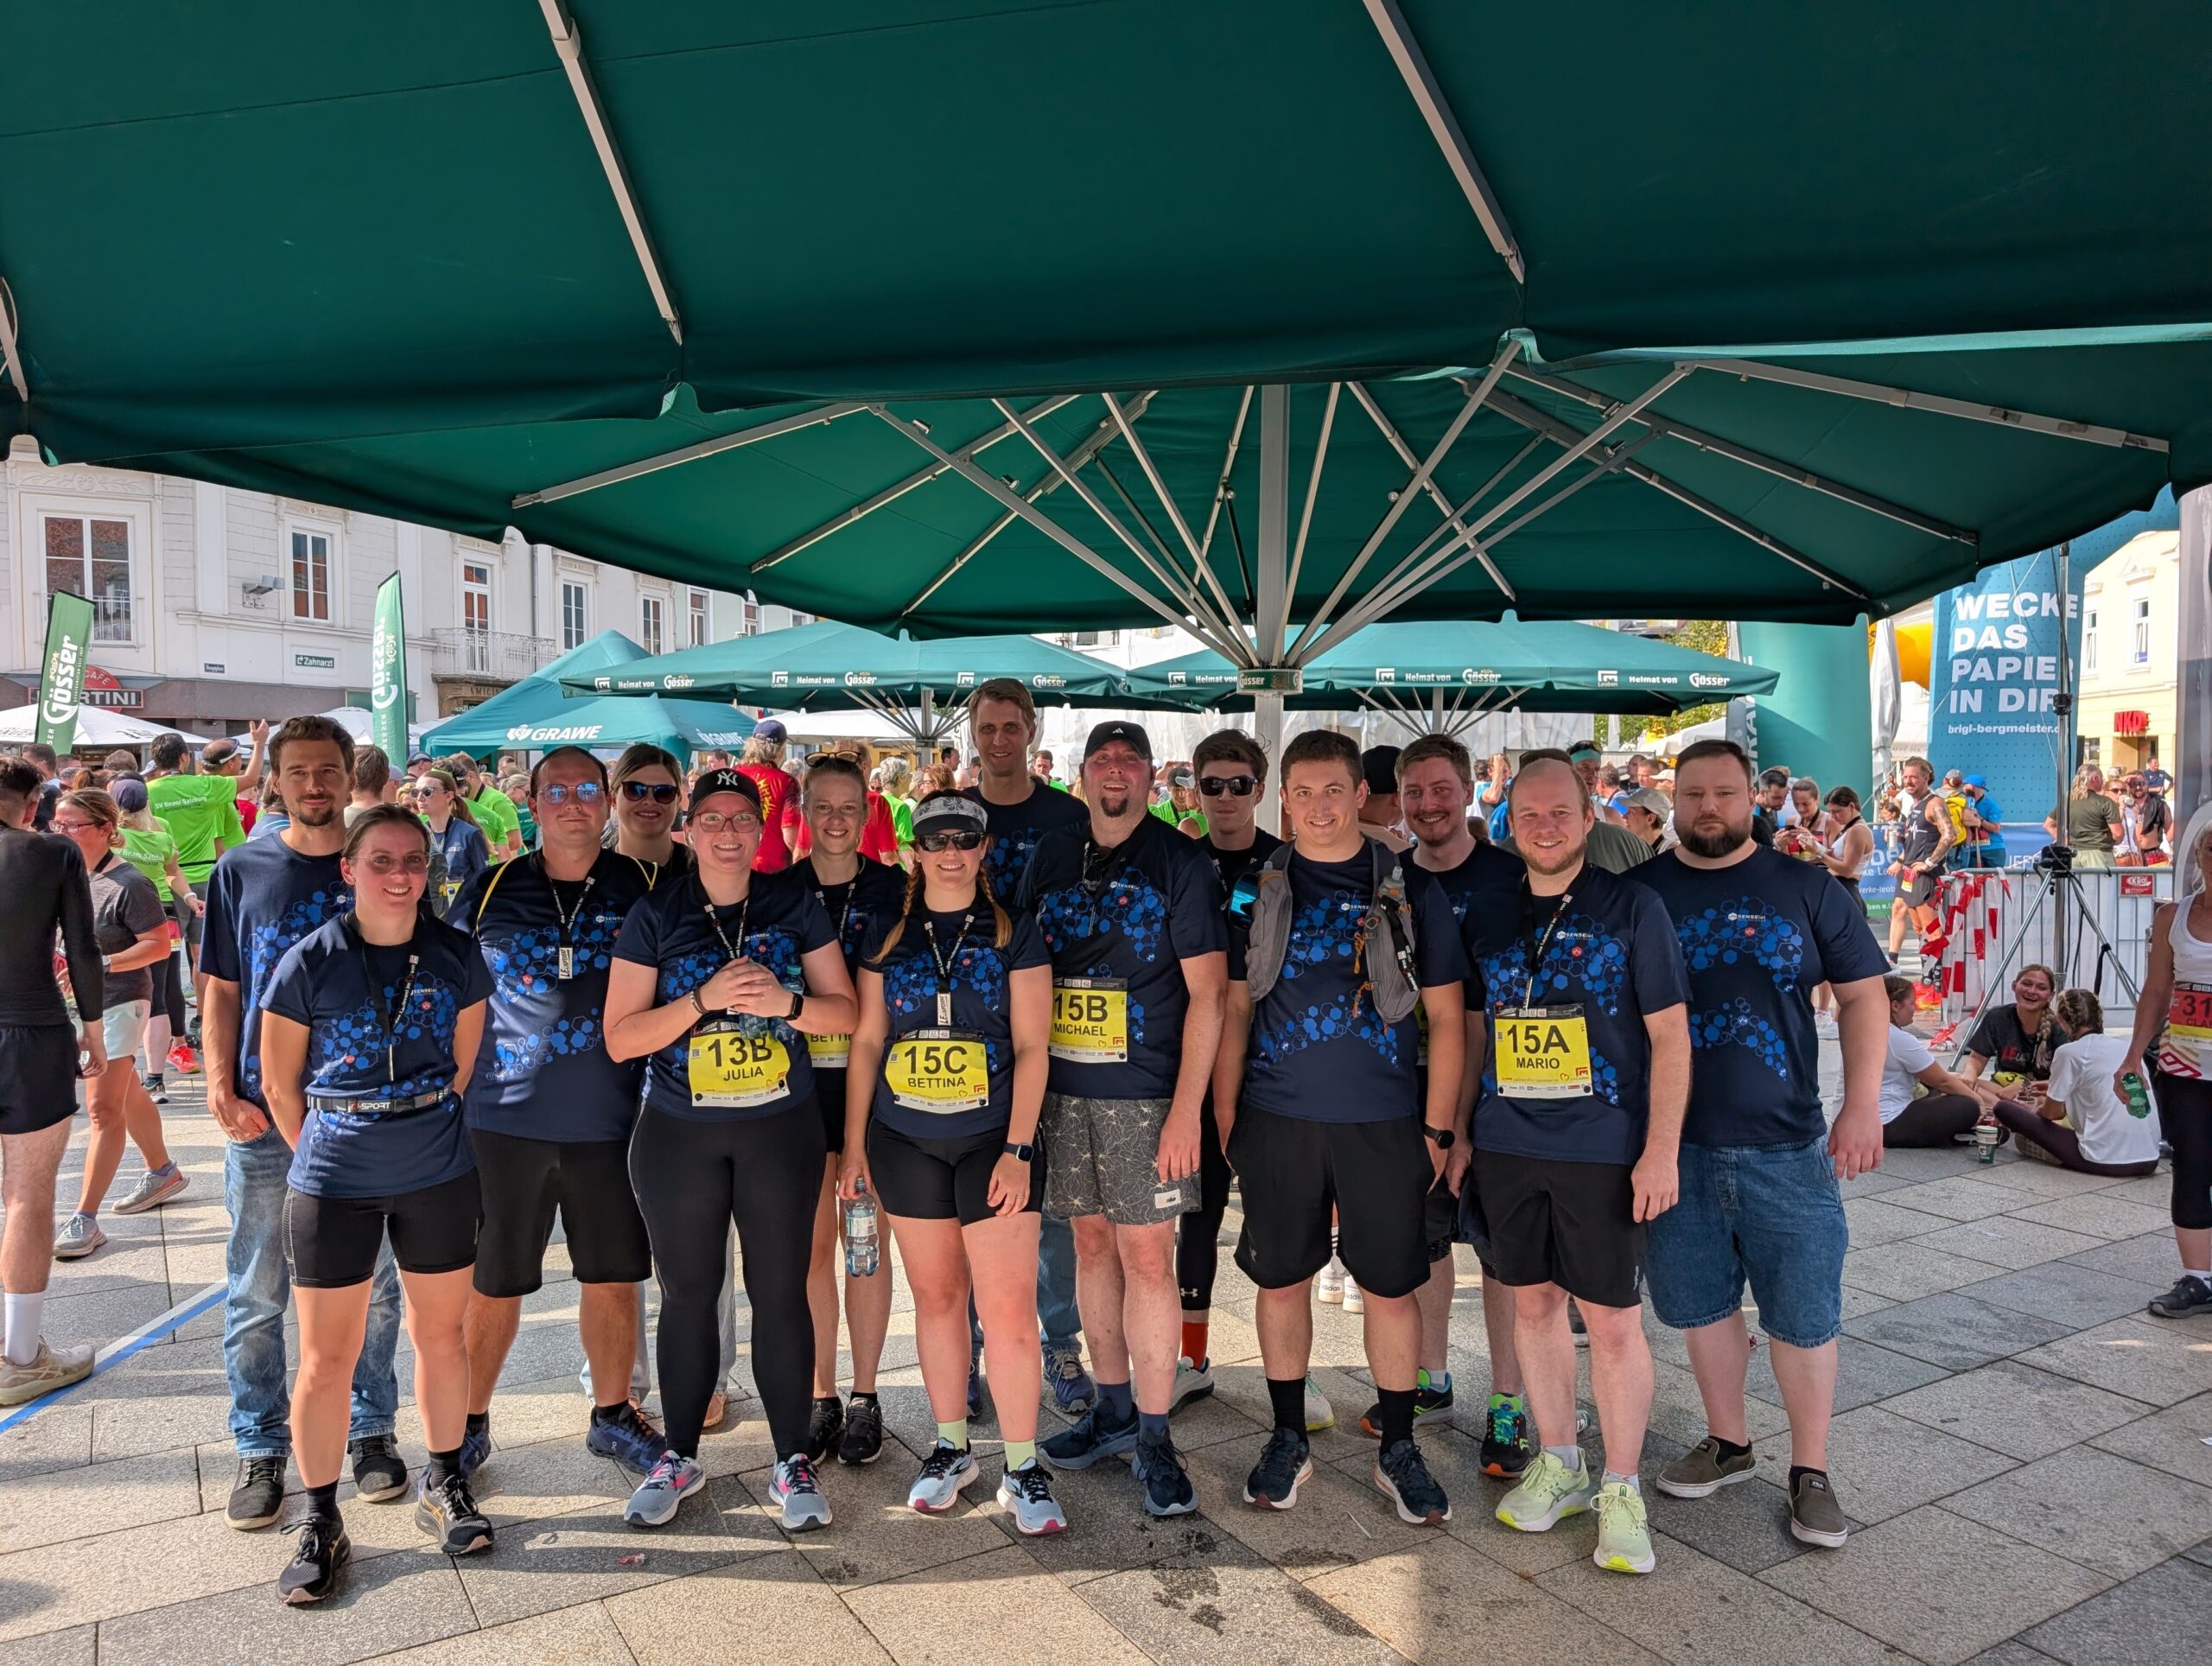
Software companies are not necessarily known for clocking up a lot of kilometres. That is probably true for us as well. But we happen to have a remarkably sporty crowd around us.
Our boss leads by example – and every year, several teams from #team3d5 and friends take part in the LE Laufevent in Leoben. The relay race is a particular favourite: three people, 66 minutes and one shared goal – to complete as many laps as possible on a two-kilometre course. By now, it has become a much-loved tradition for us. September means race time again – and the perfect opportunity to look back at the numbers.
Relay batons, support and electrolytes
After all, few things bring a team together quite as reliably as crossing the finish line bright red in the face and handing the imaginary relay baton to the next person with a high five. And those who are not running at that moment have an important job too. There is cheering, supporting and plenty of excitement from the sidelines. Water bottles are ready, towels are handed over and the next runners are sent into position at just the right time.
By the time everyone sits down together for a well-deserved electrolyte drink afterwards, lap times, personal heroics and tactical misjudgements are analysed in considerable detail. And since we are data scientists, naturally we cannot resist doing a little data analysis of our own.
The data is clear. Probably.
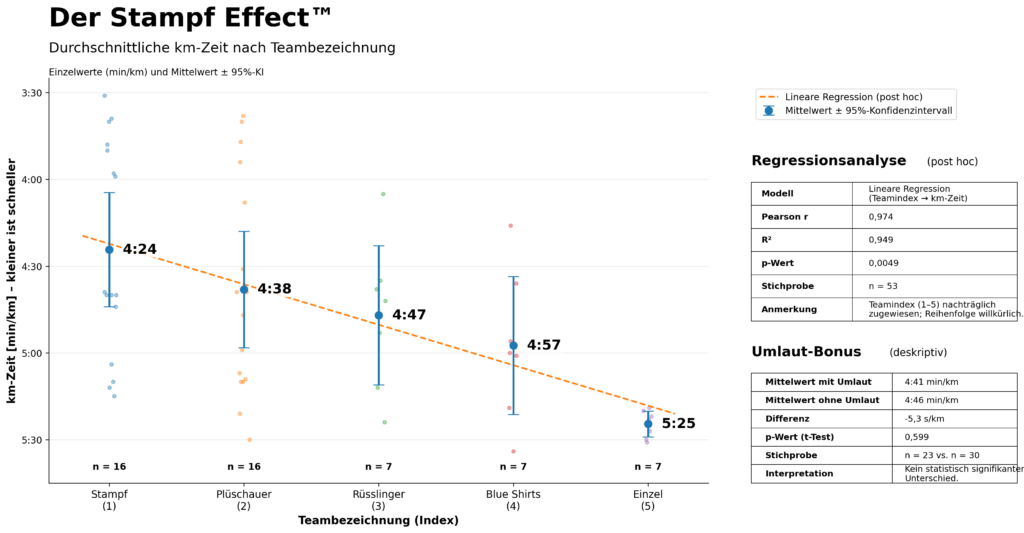
Our documented results so far include 53 running times from 2017 to 2024. The fastest: 3:31 min/km. The median: 4:47 min/km. So far, so serious.
The data.
Statistical analysis of running times recorded by #team3d5 and friends at the LE Laufevent between 2017 and 2024.
We could now investigate training levels, team composition, weather, running order or any number of other reasonably sensible influencing factors. We could. Or we could search this small dataset long enough to uncover far more interesting findings.
The Stampf EffectTM
If we look, for example, at the average pace grouped by team name, the evidence is remarkable:
- Stampf: 4:24 min/km
- Plüschauer: 4:38 min/km
- Rüsslinger: 4:47 min/km
- Blue Shirts: 4:57 min/km
- Individual: 5:25 min/km
The only scientifically defensible conclusion is obvious: anyone hoping to run faster should probably start by reconsidering their team name. Initial analyses suggest a significant relationship between the choice of team name and the lowest average pace – a phenomenon we call the Stampf Effect. Year after year, Team Stampf impressively emerges as the fastest team in the field.
The Umlaut Bonus
A closer look reveals even more. In our dataset, running times recorded under the team names Plüschauer and Rüsslinger were, on average, around five seconds per kilometre faster than those recorded under names without an umlaut. Coincidence? Possibly. A previously unknown aerodynamic effect of umlauts? We would not want to get ahead of the research. For the next LE Laufevent, renaming the teams Stämpf, Blüe Shirts or simply #tëäm3d5 should certainly not be ruled out too quickly.
Correlation is not causation
As entertaining as analyses like these may be, this is also where one of the classic pitfalls of working with data becomes apparent. A statistical relationship alone does not explain why two things occur together. In our case, the runners, team compositions and competition formats change between observations – and most likely so do training levels and external conditions. Just to make one thing absolutely clear: the fact that a particular team name appears together with faster running times does not mean that the name itself makes anyone run faster. Not even when the chart looks remarkably convincing. Or, in short:
Data needs context
That applies to running times just as much as it does to machine data. A neat trend line can point towards an interesting relationship. Turning that into reliable knowledge, however, requires context, domain knowledge and the right question. And sometimes it also requires being willing to let go of a particularly beautiful correlation.
To be continued
What we can say with considerably more confidence is this: running together, cheering each other on, suffering together and laughing about it afterwards is a lot of fun. That is why #team3d5 and friends will be back on the starting line again this year. On 19 September 2026, we will once again spend 66 minutes making our way around Leoben. We are looking forward to it.